
Exports & Visualisations
Overton’s impact dashboards bring key policy impact insights together in one dynamic space. These dashboards rely on data from your Overton profile or scholarly works affiliated with your institution. These shareable visualisations that help you communicate evidence of research impact to stakeholders at all levels.
Please note: Impact dashboards are only currently available for research institutions.
Viewing your impact dashboard
To view your dashboards, click on ‘Dashboard’ in the top menu. From the dashboard page, you choose between your individual dashboard or an institutional dashboard.
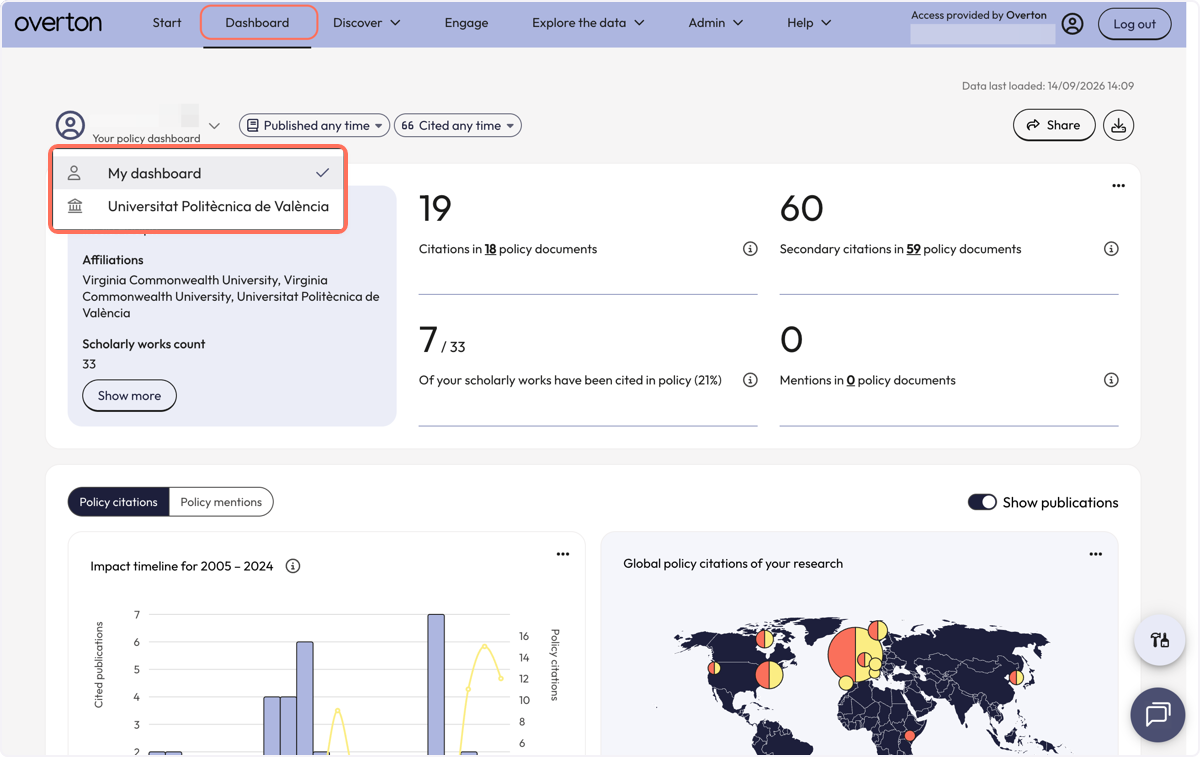
Individuals
As an individual researcher, you can build a profile based on your scholarly outputs and named affiliations. This dashboard will provide one place to explore your citations and mentions within policy documents. Individuals can customise their dashboard to explore how their work – or specific works – are showing up in policy.
See: Setting up your Overton Profile
Using filters
For individuals, additional filters can be added to further refine the results that are viewable as part of the impact dashboard. You can filter by the publication dates of your scholarly work or by the citation date of the policy document that is citing the scholarly work. There are quick dropdown options or you can choose a custom date range.

Institutions
Those with institutional access to Overton can view their organisation’s impact at-a-glance, with the dashboards bringing together the policy impact of all research affiliated with their institution.
Filters are not yet available for institutional dashboards unless your institution has a CRIS integration. To learn more about CRIS integrations, please reach out to our team.
Customising your dashboard
In order to allow you to see the visualisations that are most important to you, you can customise the order that data appears on your dashboard. Our customisation menu, which appears on the right side of your screen will allow you to turn on and off each visualisation.
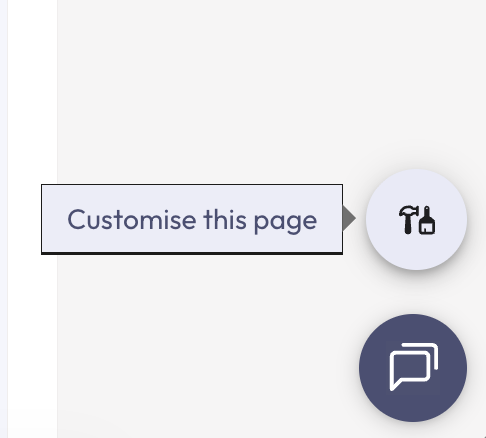
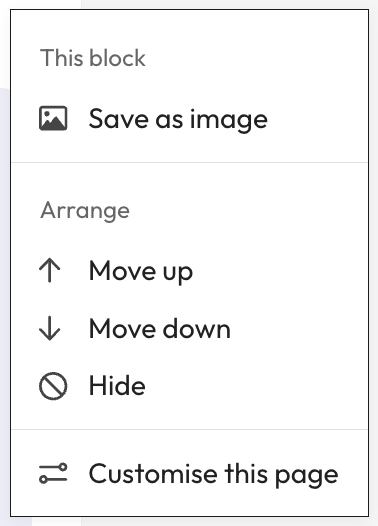
Additionally, you can use the options menu on each visualisation to move that graph up or down on the page. These can be altered and changed at any time and we will remember your preferences for next time.
Exporting and sharing your dashboard
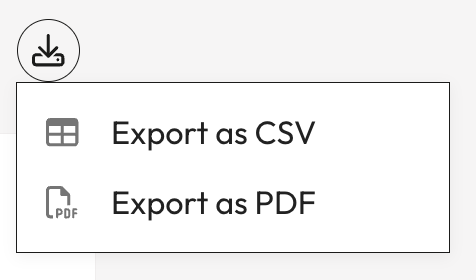
Exporting data is available from your dashboard. You can choose to export all data points within the dashboard using the export options at the top of the screen.
Alternatively, all visualisations can be saved as an image using the options menu is part of each block.
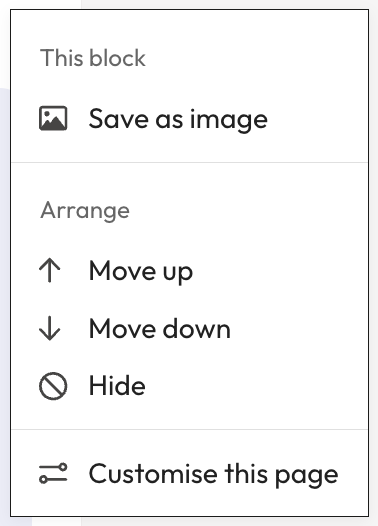
Your impact dashboards can also be shared publicly, sharing options can be found at the top of the screen. A person does not need an Overton account in order to view a dashboard that you have shared.
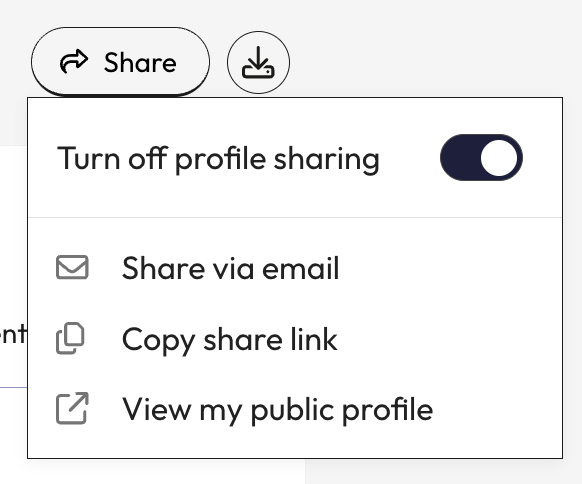
If profile sharing is on, your dashboard will be viewable via the link to anyone provided you have a valid subscription or until you turn off profile sharing.
Switching between dashboard views
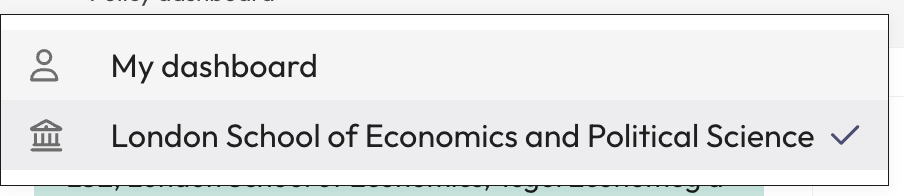
If your institution also has an impact dashboard, then you are able to switch between your personal dashboard and the institutional one using the navigation at the top of the screen.
Support & feedback
If you have any questions about the data you are seeing or would like to share feedback about our dashboards, please reach out to support@overton.io.